New interactive GE regulation map now live
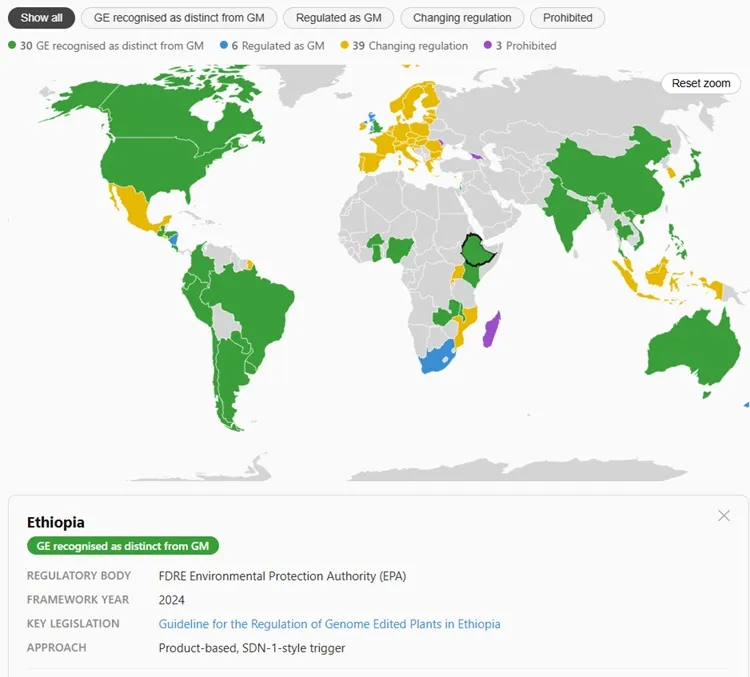
We've had a fantastic reception to the maps on this website - many thanks to everyone who reached out to us - but one request we kept receiving was for an interactive map. Initially I wasn't sure if this would be possible, but I'm pleased to say that today, after lots of hard work by the team, we have released an interactive map.
The interactive map now lives on our cropgeregulations.com/maps/ page, but I've embedded it at the foot of this post as well for quick reference.
In this post, I'll focus on the functionality of the tool and some ideas for the future.
🌎 Interactive map. Country data is now displayed in a fully interactive map that can be moved and zoomed to different magnifications - great if you're interested in areas of smaller countries that are harder to see as more global scales. The map includes a tool tip on mouse hover that quickly reports if that country has regulation recognising GE crops.
🔎 Country search. A search box at the top of the map allows the user to quickly find the status of any country by typing it in the box, rather than having to manually find the country through finding it on the map.
📋 Filter and count by regulation type. The map shows all regulatory statuses by default, but buttons under the search bar at the top right also allow the map to be filtered by specific regulation. Just below these buttons are a count of the number of countries within each category.
📰 Expanded regulatory data. Perhaps the most exciting (and the part that took the most time), you can use this interactive map to immediately bring up data on the regulatory status of countries. Clicking a country will expand a section below the map that lists:
- Country and status
- Regulatory body
- Framework year
- Key legislation - hyperlinked to the document wherever possible
- Approach - a summary of the regulatory mechanism
- Summary - an overview with more information as an overview of the context, including a link to where you can find out more.
📩 Export data. All of this data can be downloaded as a neat CSV file through a button to the bottom left of the map - perfect for anyone who wants to use the data behind this map for their own analysis or needs.
Improving the interactive map
Hopefully this new tool is helpful to the community and we will continue to push updates to it. On the list of things we're planning to include in the future:
- Historical timeline slider: Since we have date data on when these regulations are established, we would like to build in functionality to include a year-slider that shows the map state at a given date - helping researchers track the global change.
- Mobile layout: The map works fine on mobiles, but this could be improved. We're looking into building a simplified mobile view for tablets and phones.
- Shareable state: Sometimes users want share a specific zoomed point of the map with others. They could use a screenshot, but we're looking to add an image export of the current filter and zoom level into the URL so a filtered view can be linked or embedded into a report.
Let us know if you have any other suggestions.
We're keeping the static maps
Interactive maps are great, but we know static maps are much easier to use for tasks like presentations or reports. We also know that many people like having the access to our editable maps.
All our static maps are staying and will continue to be updated - they're just moving to cropgeregulations.com/ge-map-downloads/. We hope these resources can continue to help communication across this developing field.